Data Visualization
Course Outline and Readings
| C# | Date | Topics | Handouts/Deadlines |
| 1 to 3 | Lectures Taught by McCall See Blackboard for information |
Handouts
|
|
| 4 | June 8 | Histograms and Distributions Reading
|
Due
|
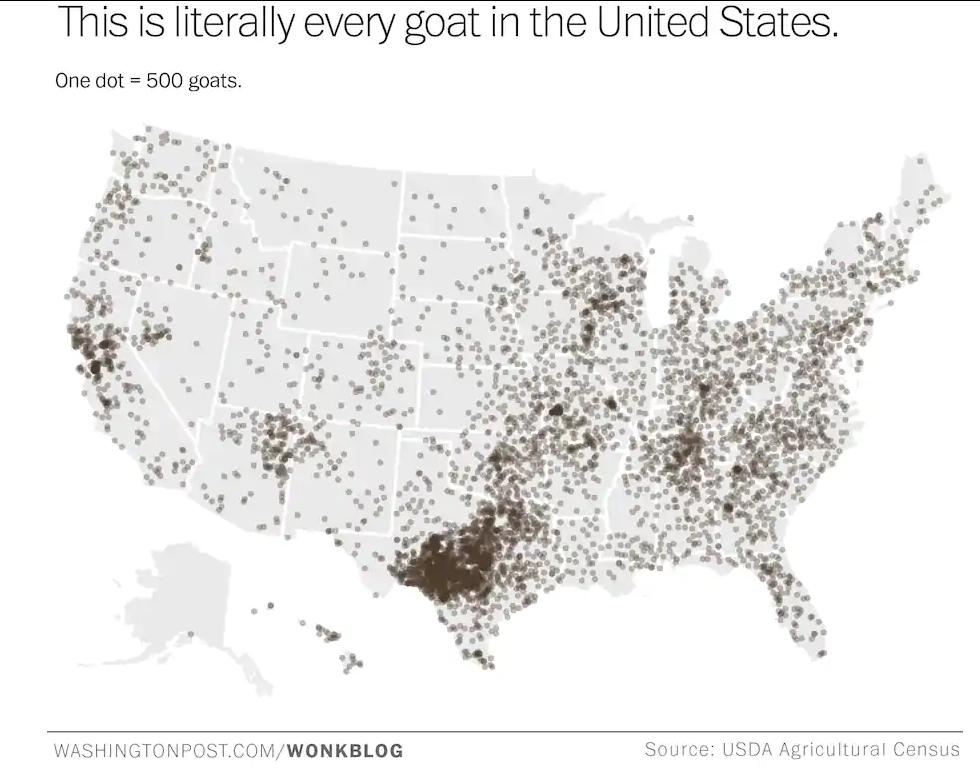
| 5 | June 15 | Maps Reading
|
Due
|
| 6 | June 22 | Line charts and Annotations Reading
|
Due
|
| 7 | June 29 | Functions, Storyboarding, and Workshop Reading
|
Due
|
| 8 | July 6 | Scatter plots and Color Reading
|
Due
|
| 9 | July 13 | Storytelling, Accessibility and Interactivity Reading
|
Due
|
| 10 | July 20 | Presentations |
Due
|
| July 27 | No class |
Due
|