Data Visualization
Course Outline and Readings
| C# | Date | Topics | Handouts/Deadlines |
| 0 | Setting Up RStudio | Handouts | |
| 1 | Jan. 11 | Data Visualization Ur-Text and Starting R Reading
|
Handouts
|
| Jan. 18 | MLK Holiday | ||
| 2 | Jan. 25 | Intro to Nuts and Bolts of Visualization and Data Prep in R Reading
|
Due
|
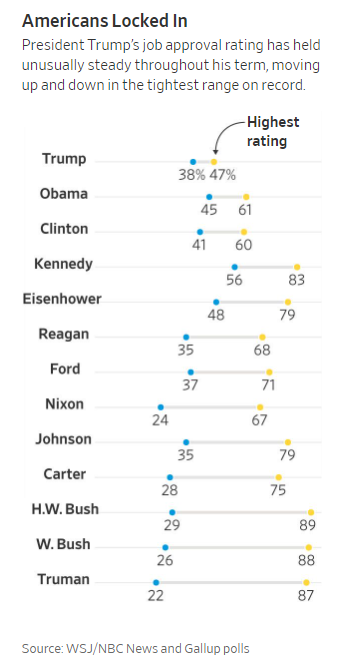
| 3 | Feb. 1 | Levels and Shares, Bars and Lollipops Reading
|
Due
|
| 4 | Feb. 8 | Histograms and Distributions Reading
|
Due
|
| Feb. 15 | Presidents Day | ||
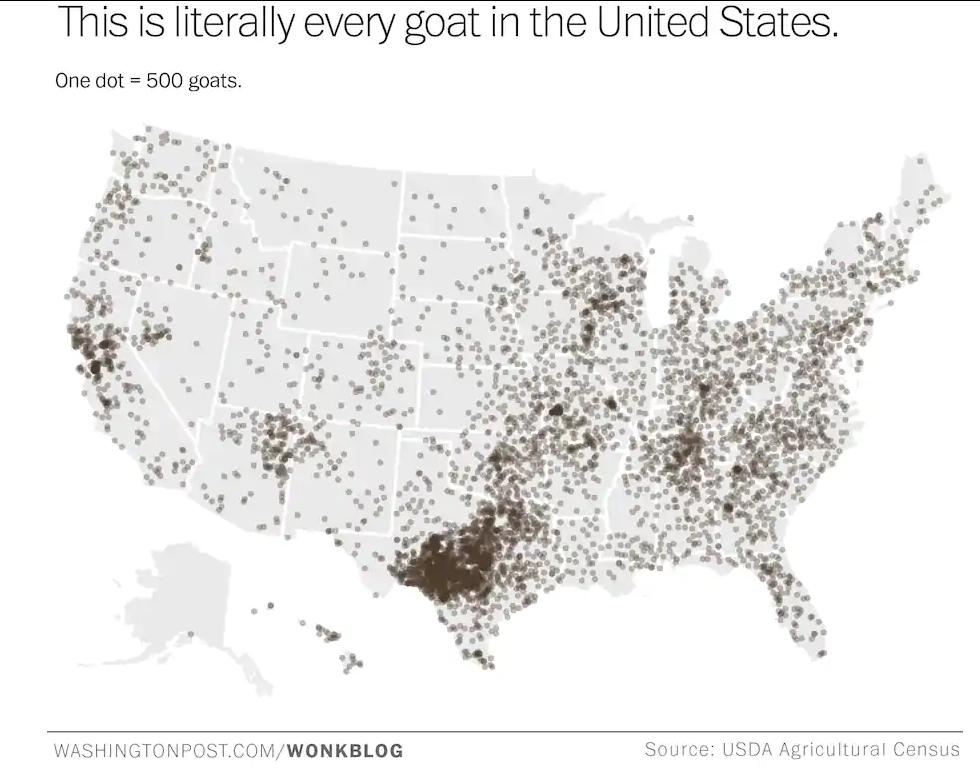
| 5 | Feb. 22 | Maps I and Data via API Reading
|
Due
|
| 6 | Mar. 1 | Functions and Storyboarding Reading
|
Due
|
| 7 | Mar. 8 | Maps II and Themes Reading
|
Due
|
| March 15 | Spring Break | ||
| 8 | March 22 | Line charts and Annotations Reading
|
Due
|
| 9 | March 29 | DV at work and in-class workshop
|
Due
|
| 10 | April 5 | Guest speaker and Scatter plots and Color Guest Speaker
|
Handouts
|
| 11 | April 12 | Student Consultations
|
|
| 12 | April 19 | Storytelling and RShiny Reading
|
Due
|
| 13 | April 26 | Video Presentations and feedback
|
Due
|
| 14 | Thurs. April 29 | Video Presentations and feedback
|
|
| Mon., May 3 |
Due
|
Good, Bad and Ugly Assignment
- Presenters and Commenters list here
- Finders must
- link a graphic on the sheet by the Wednesday noon following the lecture
- Commenters must
- come prepared with three specific points
- these can be criticisms, appreciations, or suggestions
- criticisms are best paired with suggestions
- Each student is a presenter once and a commenter once